Q2 2026 Display Market: What the Numbers Mean for Buyers
Omdia reports different growth rates for interactive panels and signage displays. Use the segment figures as context, then specify each project by its actual needs.

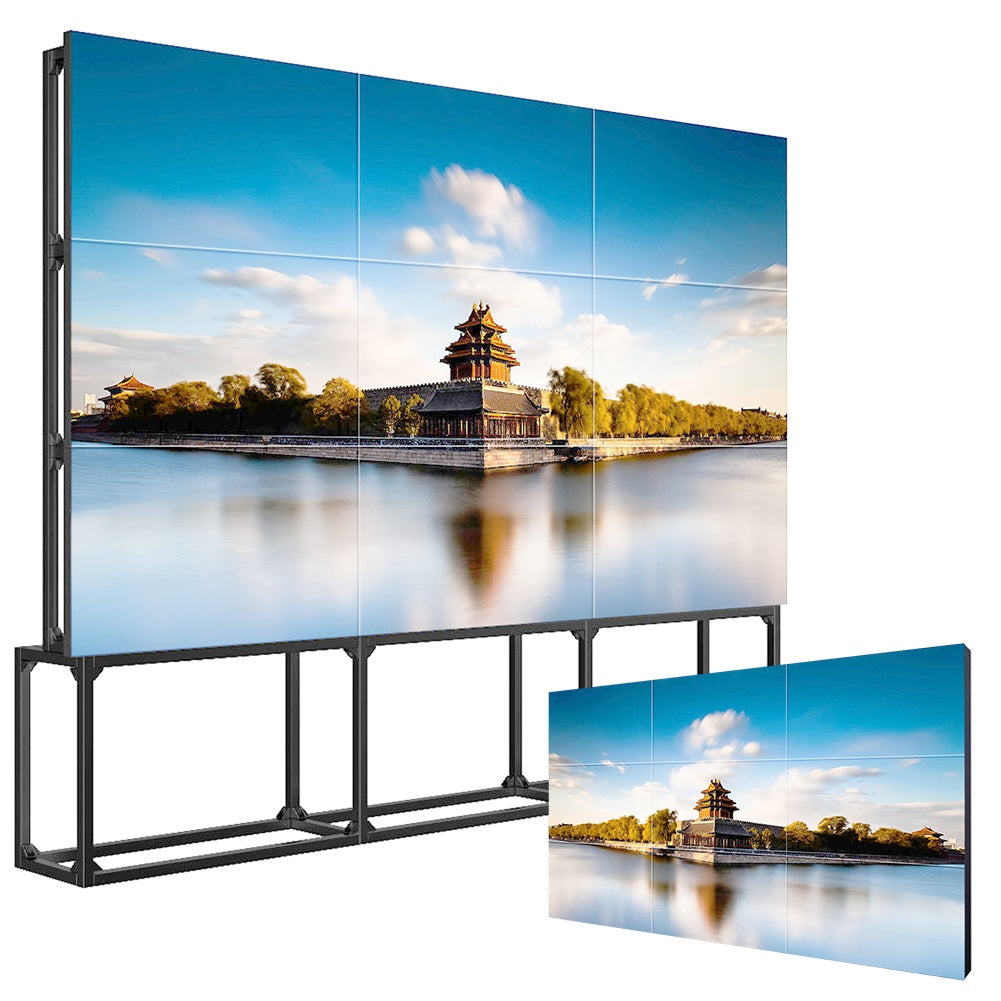
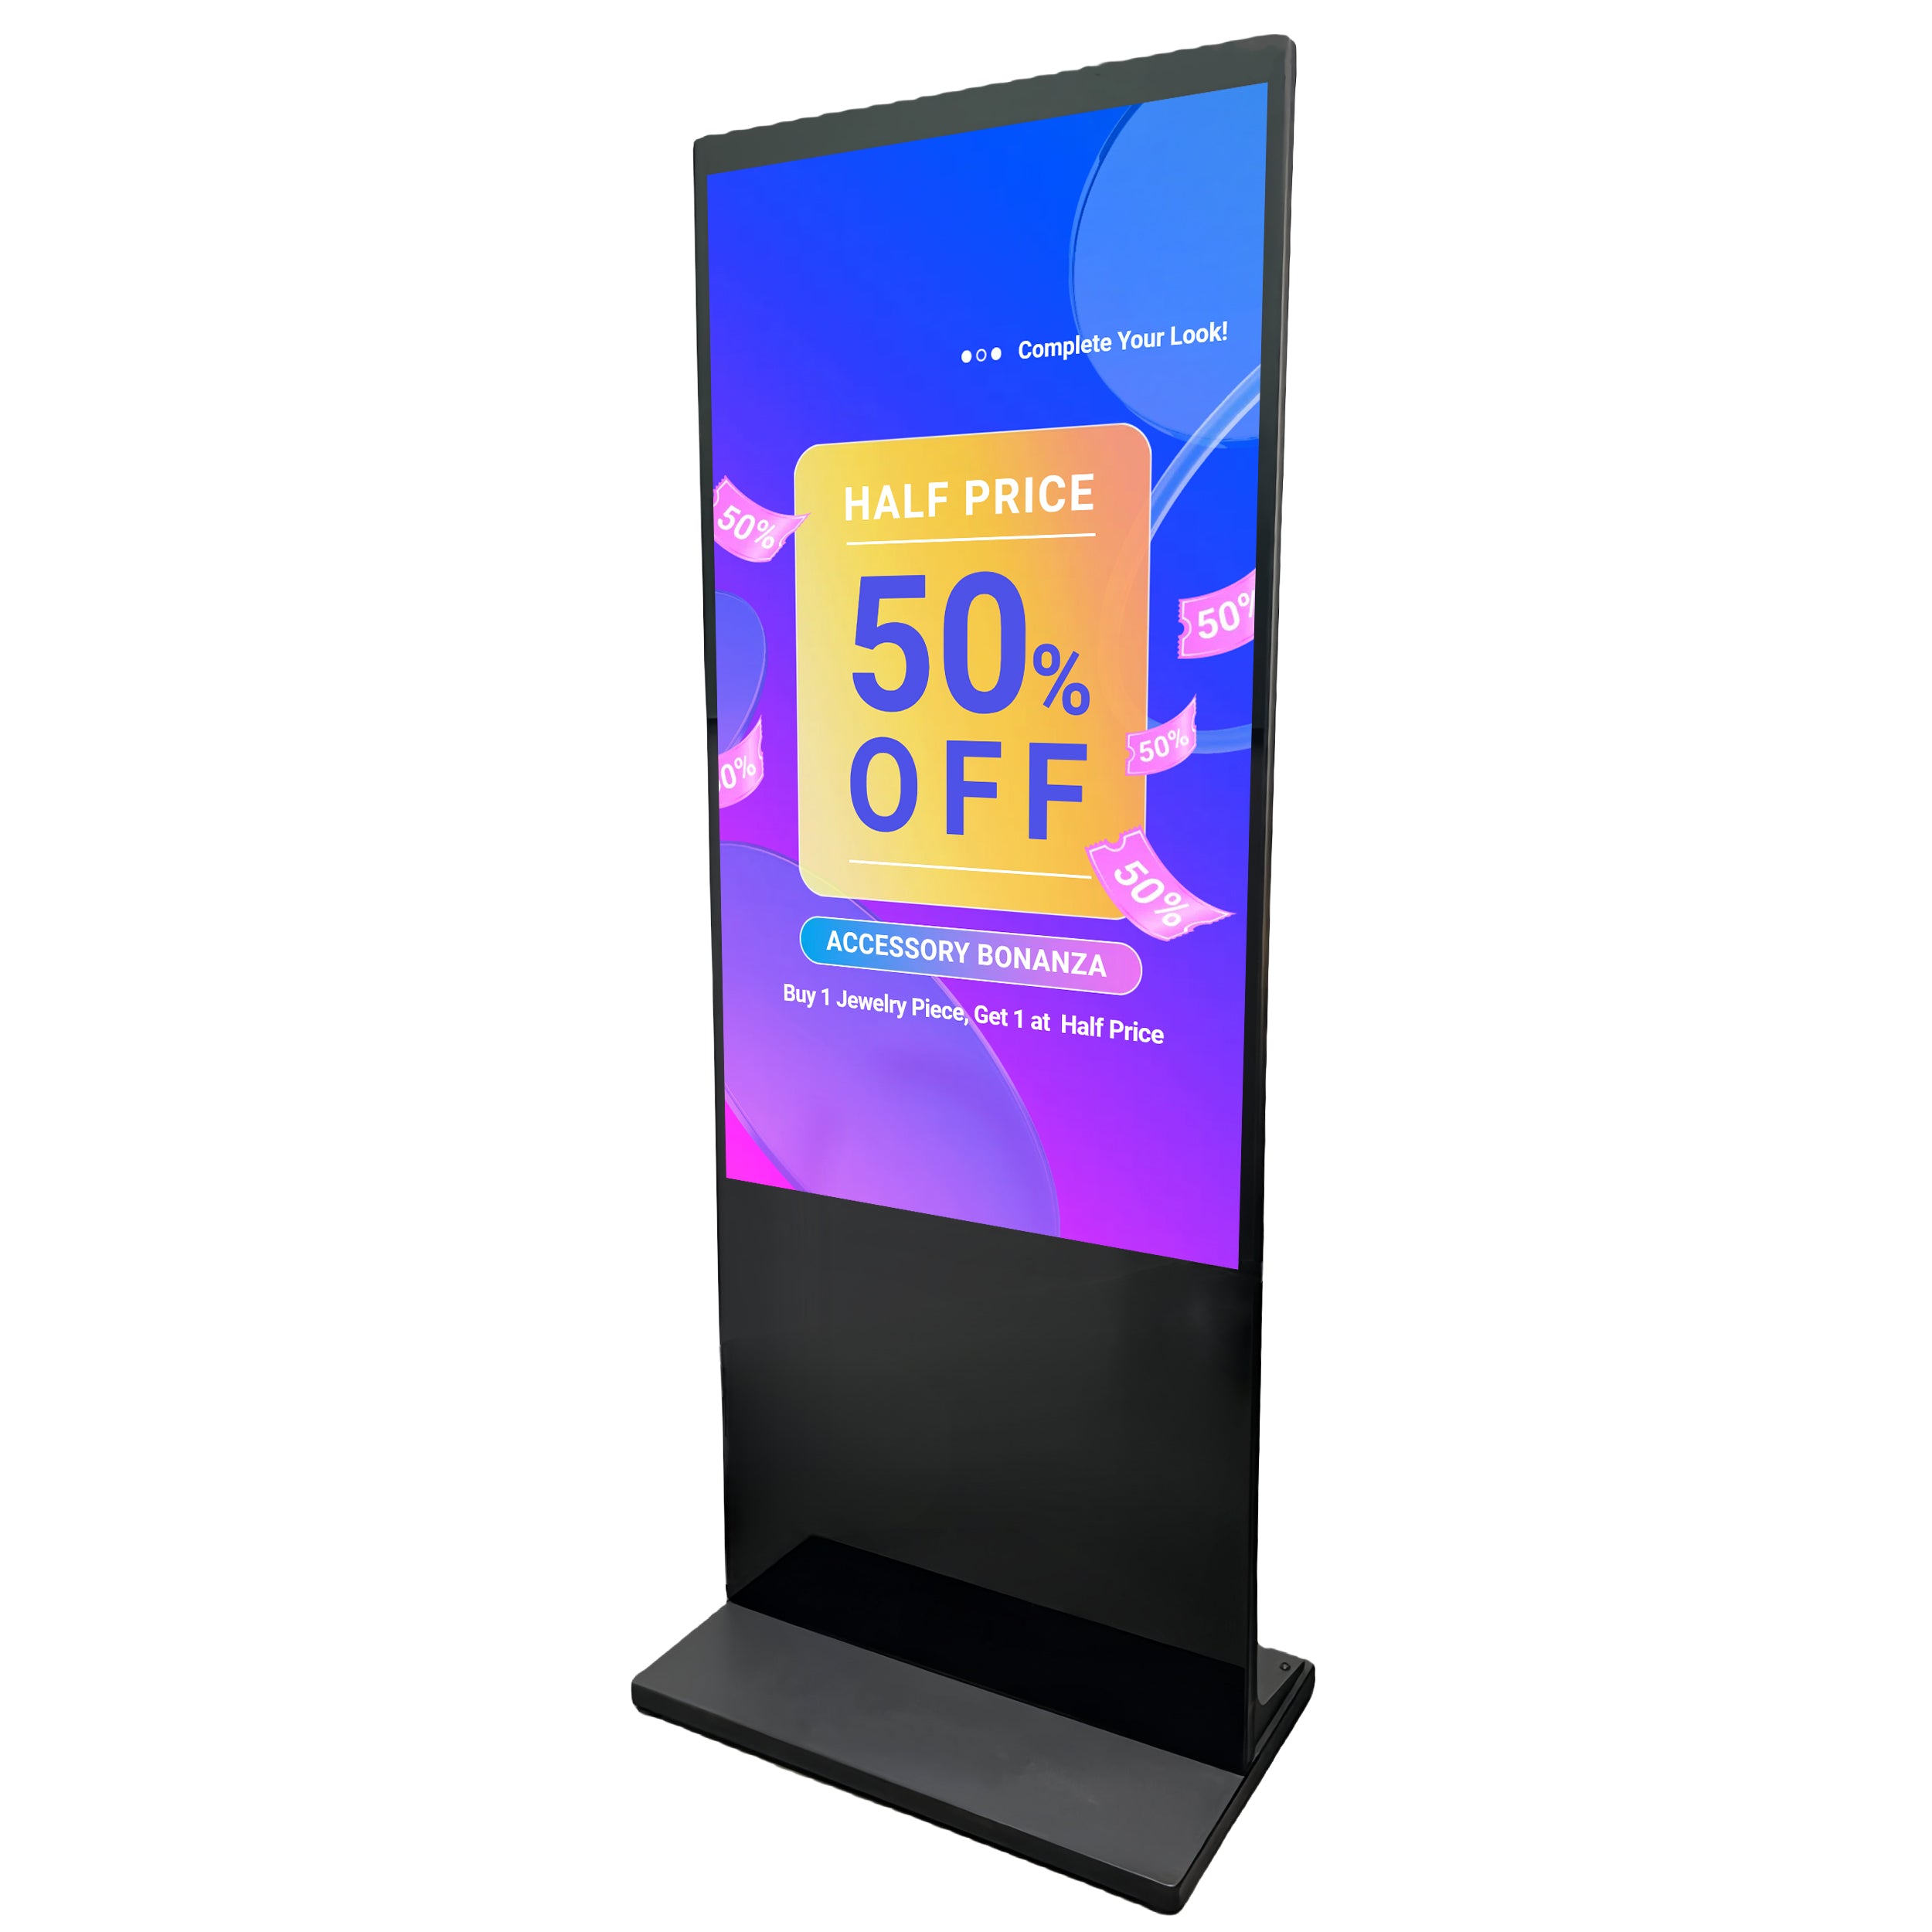
AI-generated illustration of two different display use cases; not Gemdragon product photography.
Omdia’s September 28, 2026 update reports different growth rates for interactive flat panels and signage displays. For procurement, the useful question is which category matches the job—not whether a broad market headline justifies a larger order.
For anyone specifying 43–65 inch wall-mounted or floor-standing displays, that split is the story. The market figure is not a forecast for your project; the mix inside it is what should change your next purchase order.
What the Q2 2026 data actually says
Global public display and signage TV shipments surpassed 1.73 million units in the quarter, up from 1.61 million in the previous quarter. Within that total, the two segments behaved differently.
| Segment | Quarter on quarter | Year on year |
|---|---|---|
| Interactive flat panel and touch displays | +13.7% | +0.7% |
| Signage and information displays | +2.5% | +7.9% |

Quarterly and annual comparisons answer different questions. Keep the period attached to each number; a single quarterly increase is not a forecast for your own order book.
Four questions that replace the market number

Before a segment growth rate goes near a budget, answer these four in writing — separately for each category, because the same questions have different owners on each side of the split.
| Question | Interactive flat panel | Signage display |
|---|---|---|
| Budget line | Who owns the room — facilities, IT, or the department that meets in it? | Who owns the network — marketing, operations, or IT? |
| Mounting | Mobile stand or wall — what does the room allow? | Wall or floor-standing — what do the space and the service route allow? |
| Quantity and sizes | How many rooms, and what is the viewing distance in each? | How many sites, and does the order place them together or in phases? |
| Uptime and service | What are the actual operating hours, and who notices a fault? | What are the actual operating hours, and who notices a fault? |
Quantity and sizes should follow your locations, content and viewing conditions; the 43, 55 and 65 inch comparison can help structure that review. Uptime and service need their own answers: who notices a fault, who responds and what the site does while the display is unavailable? Neither answer can be inferred from shipment growth.
On mounting, the constraint is physical. A floor-standing unit needs floor area, a power route and a base that stays stable where the public walks. A wall-mounted unit needs a structure behind the board and a service access plan. Decide that before quantity, because it usually decides quantity.
What the quarter's numbers should change
Three practical consequences, in order of usefulness.
Plan in your own category, not the headline. If your projects are retail and public-space signage, the 2.5% quarterly and 7.9% annual figures are closer to your world than 13.7% — but they are still a global aggregate, and they say nothing about your own pipeline. Decide whether to hold stock from your own confirmed projects and site schedules, and use the market figure only as background for the category you are actually buying in.
Test the extra capability against a real task. Before adding touch or another feature, name the user action it enables, the content it requires and who will maintain it. Compare those costs with the basic configuration using the project cost guide.
Ask what a forecast changes for your order. A supplier’s expectation about demand is not evidence of your price or lead time. Request a quotation with a validity period and a delivery basis for your configuration and quantity.
What this data will not tell you
Four limits, stated plainly. These are unit shipments — not revenue, not installed base, not search interest — so they say nothing about price levels or what you will be quoted. They are global, and the regional spread in the same release is wide enough that a global average describes no particular market. A forecast accompanying market data is not a completed shipment result. And none of it establishes what any individual display does, including ours; for that, the comparison that matters is still commercial-grade hardware against consumer televisions, decided product by product. If you want technology direction rather than this quarter's volumes, which signage trends deserve budget in 2026 is the closer read.
What we build sits on one side of this split: wall-mounted and floor-standing commercial displays in 43–65 inches, for system integrators and software solution providers — the signage and information side of the table above, not the meeting-room panel side.
Send us the category, the mounting and the quantity, and we will quote against your split rather than the market's. Tell us what the project actually is.